Signals · screen 1
Pop-adjusted value
Within each era, which PSA 10s trade cheap for how scarce they are. Scarcer cards cost more; this fits how much more, per era, and lists the cards sitting furthest below that line.
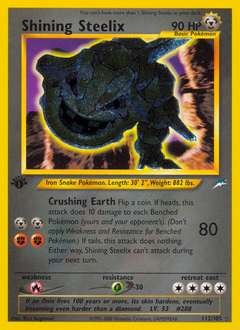
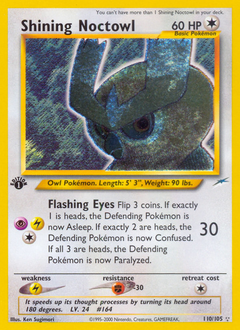
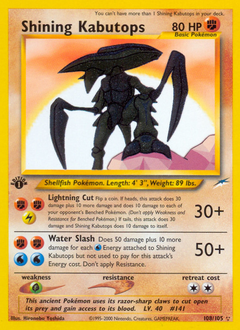
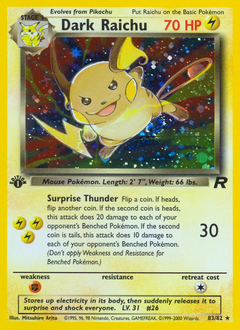
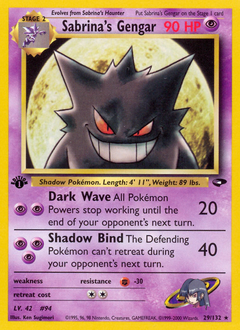
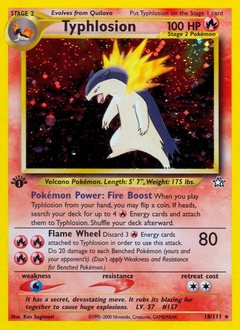
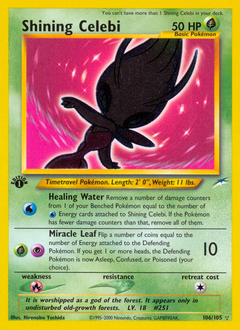
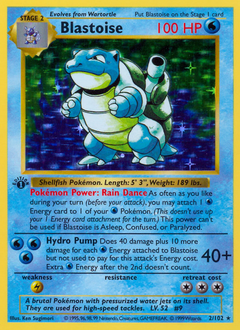
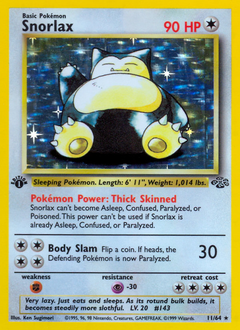
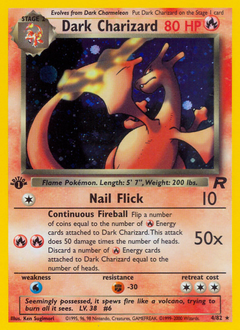
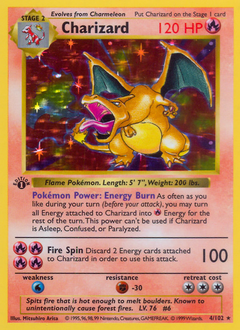
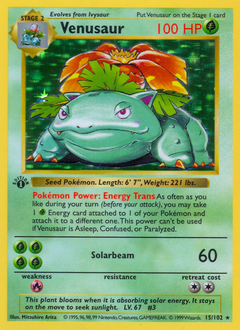
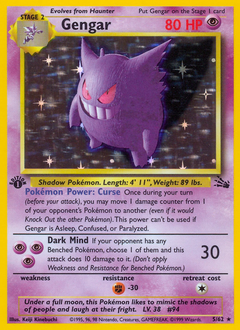
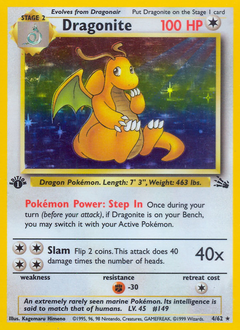
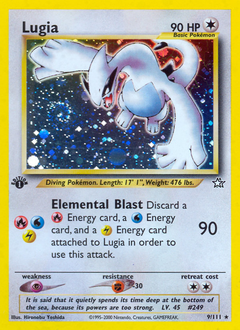
Wizards of the Coast (Vintage)
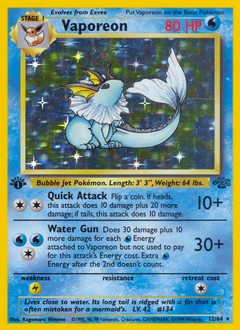
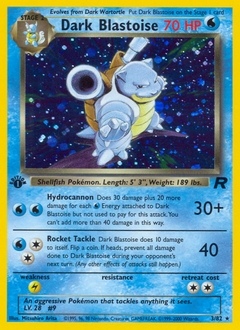
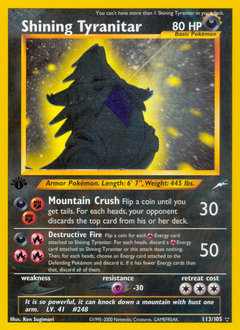
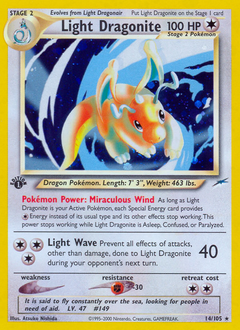
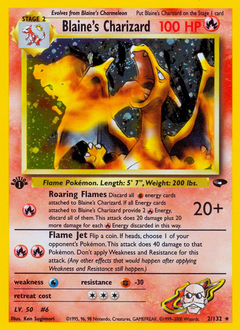
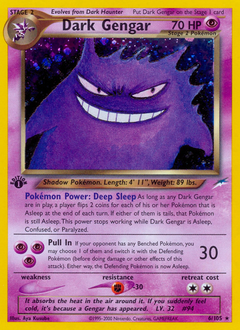
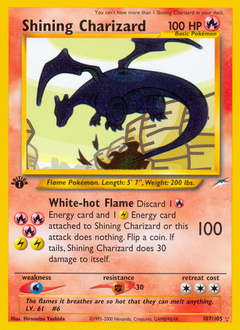
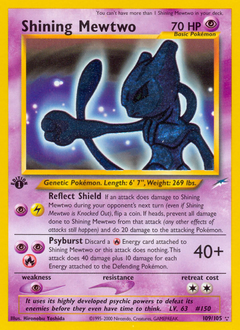
1999–200323 cardsFit: ln(price) = 10.33 − 0.24 · ln(pop), R² 0.07. Each doubling of population moves the fitted price by -15%.
EX Series
2003–200712 cardsFit: ln(price) = -0.00 + 2.25 · ln(pop), R² 0.21. Each doubling of population moves the fitted price by +376%.
| # | Card | PSA 10 pop | PSA 10 price | Float | vs curve | |
|---|---|---|---|---|---|---|
| 1 | 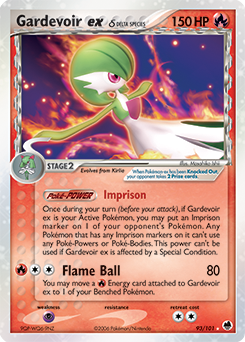 Gardevoir ex δEX Dragon Frontiers · #93 Gardevoir ex δEX Dragon Frontiers · #93 | 33 | $70.27 | $2,319 | -97% | |
| 2 | 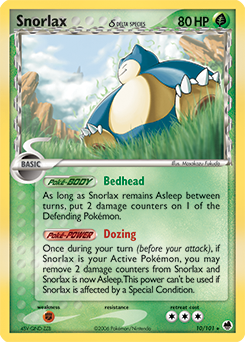 Snorlax δEX Dragon Frontiers · #10 Snorlax δEX Dragon Frontiers · #10 | 70 | $3,272 | $229,059 | -77% | thin |
| 3 | 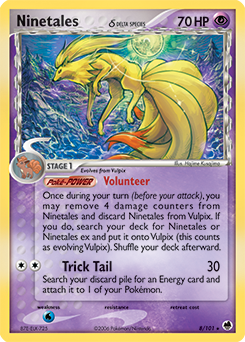 Ninetales δEX Dragon Frontiers · #8 Ninetales δEX Dragon Frontiers · #8 | 46 | $3,983 | $183,218 | -28% | |
| 4 | 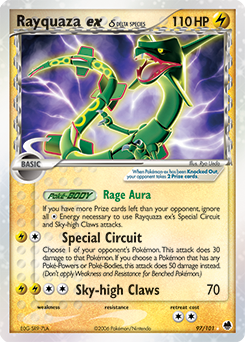 Rayquaza ex δEX Dragon Frontiers · #97 Rayquaza ex δEX Dragon Frontiers · #97 | 64 | $12,016 | $769,042 | +3% | |
| 5 | 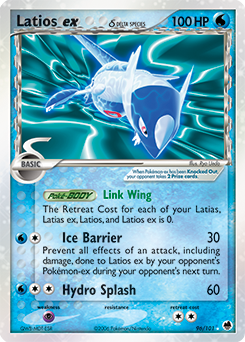 Latios ex δEX Dragon Frontiers · #96 Latios ex δEX Dragon Frontiers · #96 | 46 | $6,250 | $287,500 | +13% | |
| 6 | 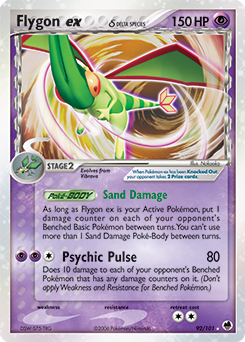 Flygon ex δEX Dragon Frontiers · #92 Flygon ex δEX Dragon Frontiers · #92 | 36 | $4,059 | $146,118 | +27% | |
| 7 | 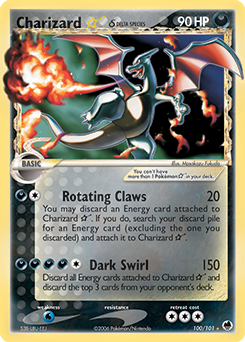 Charizard ★EX Dragon Frontiers · #100 Charizard ★EX Dragon Frontiers · #100 | 98 | $51,574 | $5,054,284 | +70% | |
| 8 | 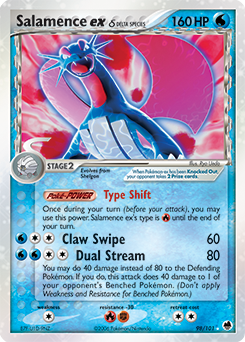 Salamence ex δEX Dragon Frontiers · #98 Salamence ex δEX Dragon Frontiers · #98 | 41 | $7,487 | $306,977 | +75% | |
| 9 | 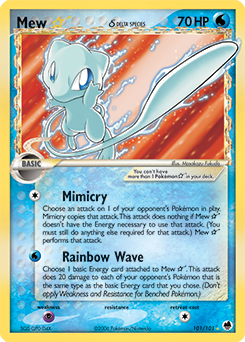 Mew ★EX Dragon Frontiers · #101 Mew ★EX Dragon Frontiers · #101 | 73 | $38,995 | $2,846,635 | +149% | thin |
| 10 | 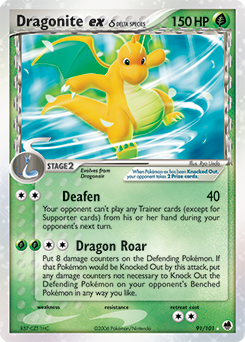 Dragonite ex δEX Dragon Frontiers · #91 Dragonite ex δEX Dragon Frontiers · #91 | 30 | $43,500 | $1,304,999 | +1957% | thin |
| 11 | 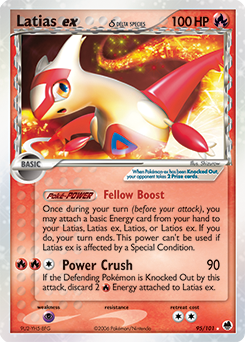 Latias ex δEX Dragon Frontiers · #95 Latias ex δEX Dragon Frontiers · #95 | 32 | $436 | $13,950 | — | modelled |
| 12 | 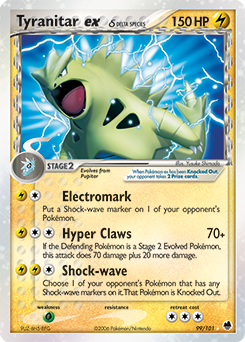 Tyranitar ex δEX Dragon Frontiers · #99 Tyranitar ex δEX Dragon Frontiers · #99 | 20 | $588 | $11,757 | — | modelled |
Diamond & Pearl / Platinum
2007–201011 cardsFit: ln(price) = 8.33 + 0.23 · ln(pop), R² 0.17. Each doubling of population moves the fitted price by +17%.
| # | Card | PSA 10 pop | PSA 10 price | Float | vs curve | |
|---|---|---|---|---|---|---|
| 1 | 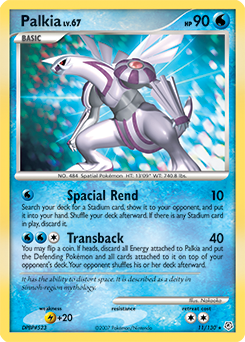 PalkiaDiamond & Pearl · #11 PalkiaDiamond & Pearl · #11 | 9 | $4,550 | $40,950 | -34% | thin |
| 2 | 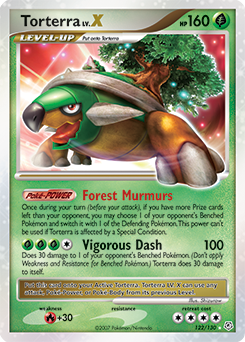 Torterra LV.XDiamond & Pearl · #122 Torterra LV.XDiamond & Pearl · #122 | 58 | $7,625 | $442,250 | -28% | |
| 3 | 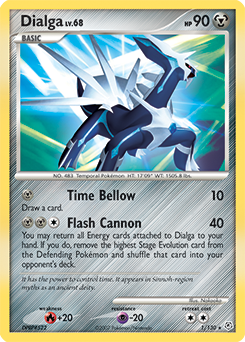 DialgaDiamond & Pearl · #1 DialgaDiamond & Pearl · #1 | 7 | $4,700 | $32,900 | -28% | thin |
| 4 | 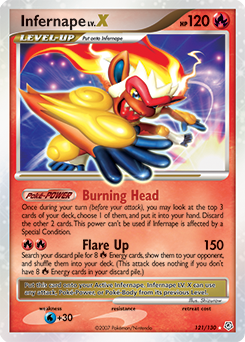 Infernape LV.XDiamond & Pearl · #121 Infernape LV.XDiamond & Pearl · #121 | 63 | $9,923 | $625,128 | -8% | |
| 5 | 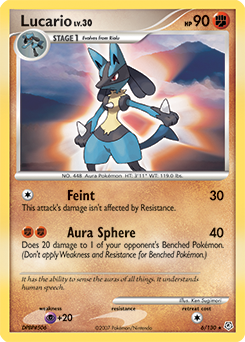 LucarioDiamond & Pearl · #6 LucarioDiamond & Pearl · #6 | 7 | $8,070 | $56,490 | +24% | thin |
| 6 | 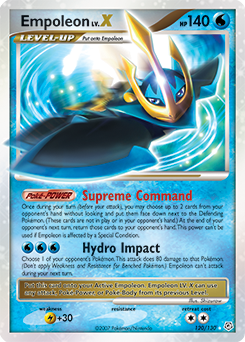 Empoleon LV.XDiamond & Pearl · #120 Empoleon LV.XDiamond & Pearl · #120 | 20 | $21,454 | $429,080 | +158% | thin |
| 7 | 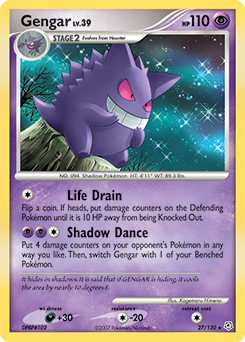 GengarDiamond & Pearl · #27 GengarDiamond & Pearl · #27 | 4 | $151 | $604 | — | modelled |
| 8 | 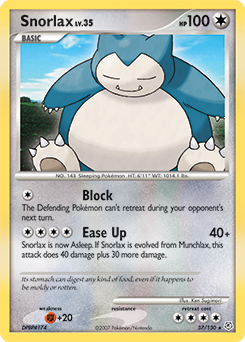 SnorlaxDiamond & Pearl · #37 SnorlaxDiamond & Pearl · #37 | 2 | $183 | $365 | — | modelled |
| 9 | 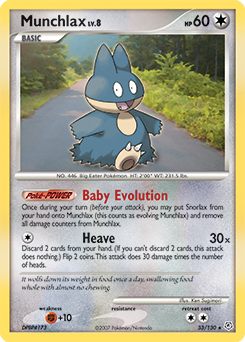 MunchlaxDiamond & Pearl · #33 MunchlaxDiamond & Pearl · #33 | 1 | $189 | $189 | — | modelled |
| 10 | 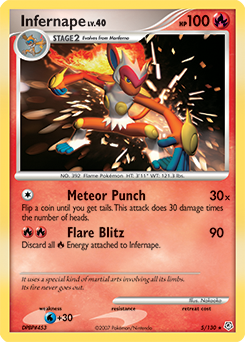 InfernapeDiamond & Pearl · #5 InfernapeDiamond & Pearl · #5 | 4 | $463 | $1,854 | — | modelled |
| 11 | 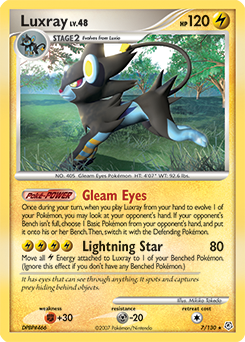 LuxrayDiamond & Pearl · #7 LuxrayDiamond & Pearl · #7 | 8 | $499 | $3,993 | — | modelled |
Black & White
2011–20133 cardsFewer than 4 cards with observed inputs; listed by PSA 10 price, no fit.
| # | Card | PSA 10 pop | PSA 10 price | Float | vs curve | |
|---|---|---|---|---|---|---|
| 1 | 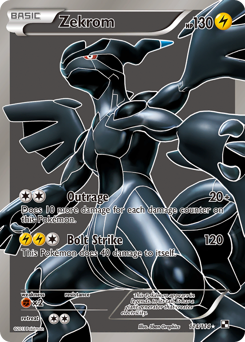 ZekromBlack & White · #114 ZekromBlack & White · #114 | 281 | $942 | $264,747 | — | |
| 2 | 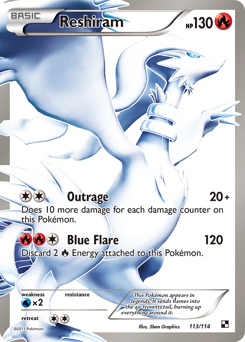 ReshiramBlack & White · #113 ReshiramBlack & White · #113 | 267 | $1,006 | $268,666 | — | thin |
| 3 | 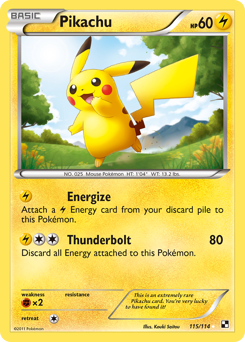 PikachuBlack & White · #115 PikachuBlack & White · #115 | 210 | $3,549 | $745,311 | — |
XY
2014–201612 cardsFit: ln(price) = 10.48 − 0.55 · ln(pop), R² 0.34. Each doubling of population moves the fitted price by -32%.
| # | Card | PSA 10 pop | PSA 10 price | Float | vs curve | |
|---|---|---|---|---|---|---|
| 1 | 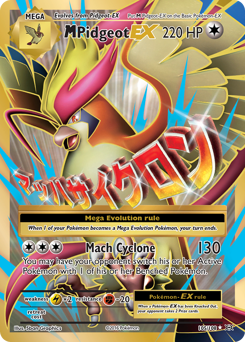 M Pidgeot-EXXY Evolutions · #105 M Pidgeot-EXXY Evolutions · #105 | 2,262 | $141 | $319,213 | -71% | |
| 2 | 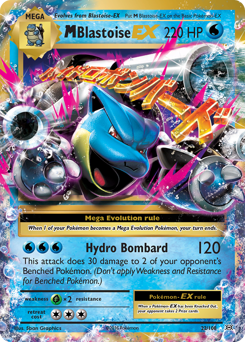 M Blastoise-EXXY Evolutions · #22 M Blastoise-EXXY Evolutions · #22 | 3,401 | $168 | $571,266 | -57% | |
| 3 |  Misty's DeterminationXY Evolutions · #108 Misty's DeterminationXY Evolutions · #108 | 2,341 | $227 | $531,501 | -53% | |
| 4 | 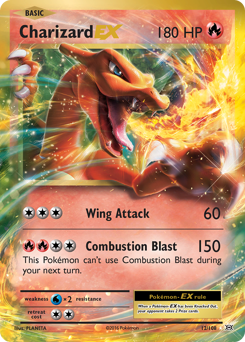 Charizard-EXXY Evolutions · #12 Charizard-EXXY Evolutions · #12 | 4,531 | $166 | $750,696 | -51% | |
| 5 | 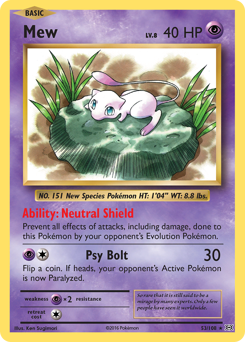 MewXY Evolutions · #53 MewXY Evolutions · #53 | 277 | $1,520 | $421,040 | -4% | thin |
| 6 |  M Venusaur-EXXY Evolutions · #100 M Venusaur-EXXY Evolutions · #100 | 5,338 | $307 | $1,640,207 | +0% | |
| 7 | 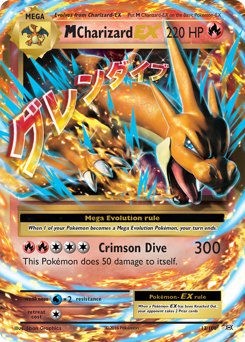 M Charizard-EXXY Evolutions · #13 M Charizard-EXXY Evolutions · #13 | 10,140 | $227 | $2,300,259 | +6% | |
| 8 | 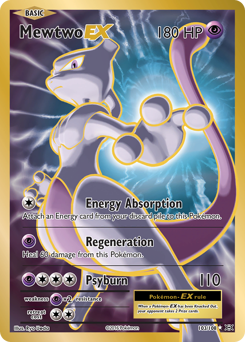 Mewtwo-EXXY Evolutions · #103 Mewtwo-EXXY Evolutions · #103 | 3,266 | $444 | $1,451,541 | +11% | |
| 9 | 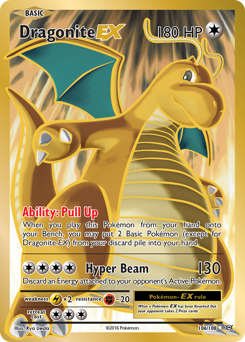 Dragonite-EXXY Evolutions · #106 Dragonite-EXXY Evolutions · #106 | 4,057 | $422 | $1,711,283 | +18% | |
| 10 | 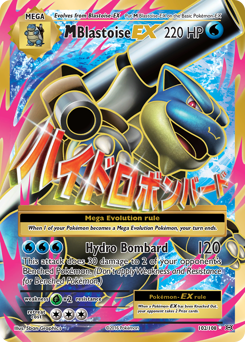 M Blastoise-EXXY Evolutions · #102 M Blastoise-EXXY Evolutions · #102 | 6,377 | $395 | $2,520,701 | +42% | |
| 11 | 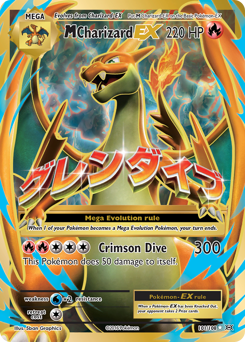 M Charizard-EXXY Evolutions · #101 M Charizard-EXXY Evolutions · #101 | 13,398 | $681 | $9,123,100 | +270% | |
| 12 | 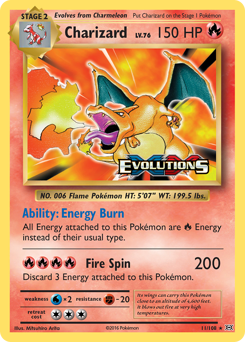 CharizardXY Evolutions · #11 CharizardXY Evolutions · #11 | 602 | $5,121 | $3,082,914 | +399% | thin |
Sun & Moon
2017–201912 cardsFit: ln(price) = -7.56 + 1.55 · ln(pop), R² 0.65. Each doubling of population moves the fitted price by +193%.
| # | Card | PSA 10 pop | PSA 10 price | Float | vs curve | |
|---|---|---|---|---|---|---|
| 1 | 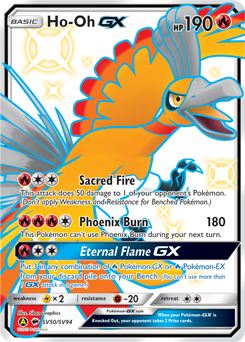 Ho-Oh-GXHidden Fates: Shiny Vault · #SV50 Ho-Oh-GXHidden Fates: Shiny Vault · #SV50 | 4,603 | $123 | $566,123 | -51% | |
| 2 | 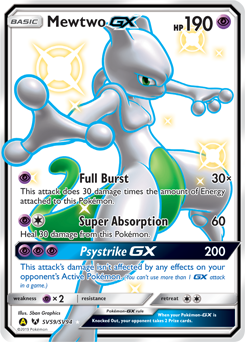 Mewtwo-GXHidden Fates: Shiny Vault · #SV59 Mewtwo-GXHidden Fates: Shiny Vault · #SV59 | 7,508 | $310 | $2,330,483 | -42% | |
| 3 | 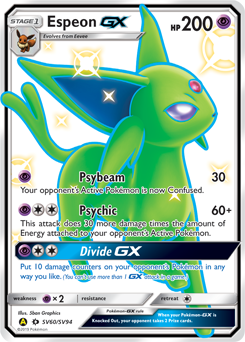 Espeon-GXHidden Fates: Shiny Vault · #SV60 Espeon-GXHidden Fates: Shiny Vault · #SV60 | 6,013 | $269 | $1,619,902 | -29% | |
| 4 | 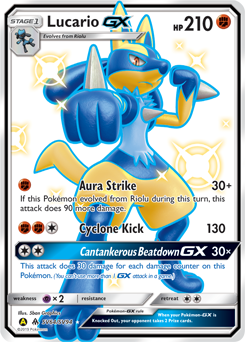 Lucario-GXHidden Fates: Shiny Vault · #SV64 Lucario-GXHidden Fates: Shiny Vault · #SV64 | 4,594 | $201 | $924,864 | -19% | |
| 5 | 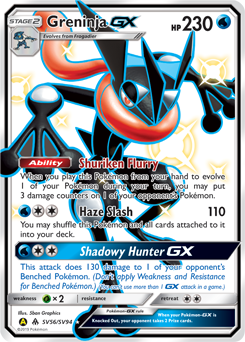 Greninja-GXHidden Fates: Shiny Vault · #SV56 Greninja-GXHidden Fates: Shiny Vault · #SV56 | 5,099 | $259 | $1,318,448 | -12% | |
| 6 | 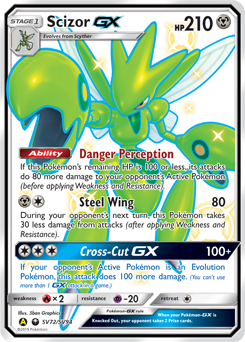 Scizor-GXHidden Fates: Shiny Vault · #SV72 Scizor-GXHidden Fates: Shiny Vault · #SV72 | 3,367 | $147 | $494,814 | -4% | |
| 7 | 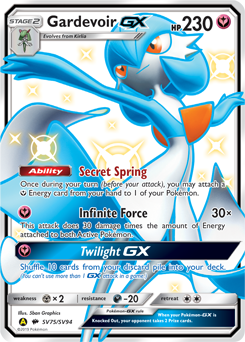 Gardevoir-GXHidden Fates: Shiny Vault · #SV75 Gardevoir-GXHidden Fates: Shiny Vault · #SV75 | 2,883 | $134 | $386,178 | +11% | |
| 8 |  CynthiaHidden Fates: Shiny Vault · #SV82 CynthiaHidden Fates: Shiny Vault · #SV82 | 4,628 | $283 | $1,308,891 | +12% | |
| 9 | 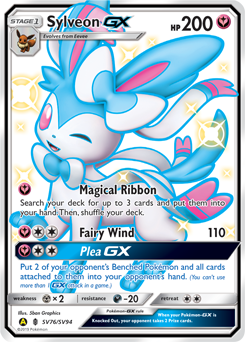 Sylveon-GXHidden Fates: Shiny Vault · #SV76 Sylveon-GXHidden Fates: Shiny Vault · #SV76 | 5,384 | $381 | $2,049,904 | +20% | |
| 10 | 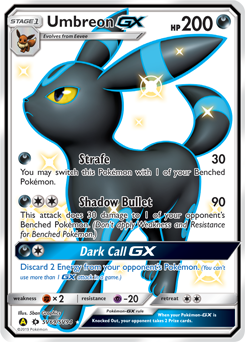 Umbreon-GXHidden Fates: Shiny Vault · #SV69 Umbreon-GXHidden Fates: Shiny Vault · #SV69 | 7,037 | $665 | $4,679,324 | +38% | |
| 11 | 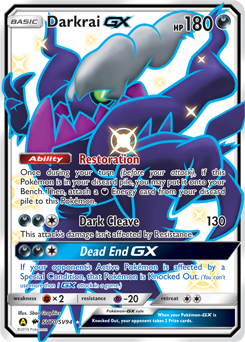 Darkrai-GXHidden Fates: Shiny Vault · #SV70 Darkrai-GXHidden Fates: Shiny Vault · #SV70 | 3,070 | $242 | $741,497 | +81% | |
| 12 | 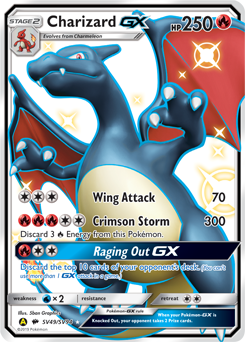 Charizard-GXHidden Fates: Shiny Vault · #SV49 Charizard-GXHidden Fates: Shiny Vault · #SV49 | 9,623 | $1,495 | $14,389,272 | +91% |
Sword & Shield
2020–202212 cardsFit: ln(price) = -8.89 + 1.69 · ln(pop), R² 0.76. Each doubling of population moves the fitted price by +222%.
| # | Card | PSA 10 pop | PSA 10 price | Float | vs curve | |
|---|---|---|---|---|---|---|
| 1 |  Sylveon VMAXEvolving Skies · #212 Sylveon VMAXEvolving Skies · #212 | 14,210 | $686 | $9,745,929 | -51% | |
| 2 |  Leafeon VMAXEvolving Skies · #205 Leafeon VMAXEvolving Skies · #205 | 11,343 | $598 | $6,779,257 | -37% | |
| 3 | 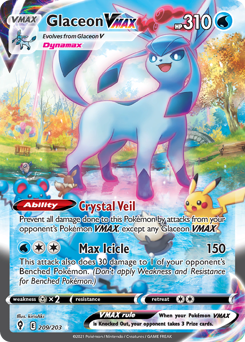 Glaceon VMAXEvolving Skies · #209 Glaceon VMAXEvolving Skies · #209 | 10,960 | $568 | $6,224,074 | -37% | |
| 4 |  Leafeon VEvolving Skies · #167 Leafeon VEvolving Skies · #167 | 6,598 | $303 | $2,000,316 | -21% | |
| 5 | 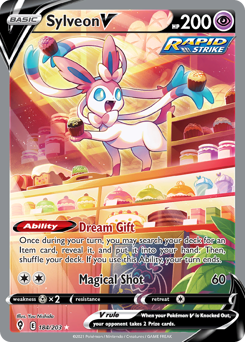 Sylveon VEvolving Skies · #184 Sylveon VEvolving Skies · #184 | 7,117 | $396 | $2,818,474 | -9% | |
| 6 | 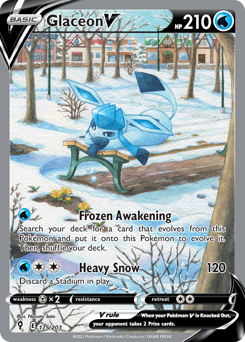 Glaceon VEvolving Skies · #175 Glaceon VEvolving Skies · #175 | 6,295 | $324 | $2,037,566 | -9% | |
| 7 | 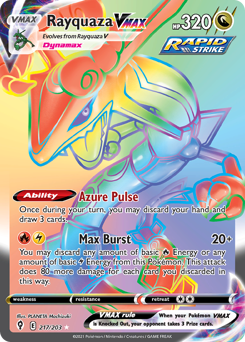 Rayquaza VMAXEvolving Skies · #217 Rayquaza VMAXEvolving Skies · #217 | 4,624 | $246 | $1,137,735 | +17% | |
| 8 | 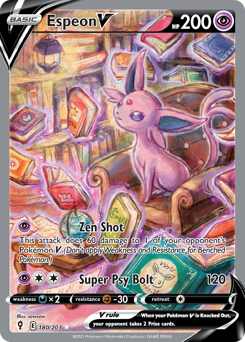 Espeon VEvolving Skies · #180 Espeon VEvolving Skies · #180 | 6,859 | $502 | $3,440,680 | +23% | |
| 9 | 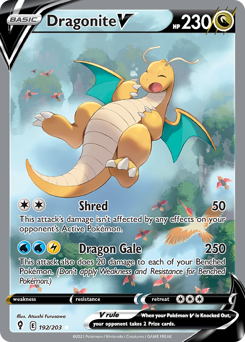 Dragonite VEvolving Skies · #192 Dragonite VEvolving Skies · #192 | 10,653 | $1,133 | $12,066,014 | +32% | |
| 10 | 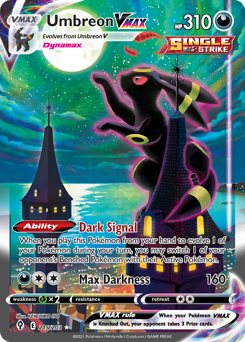 Umbreon VMAXEvolving Skies · #215 Umbreon VMAXEvolving Skies · #215 | 21,565 | $4,052 | $87,384,615 | +43% | |
| 11 | 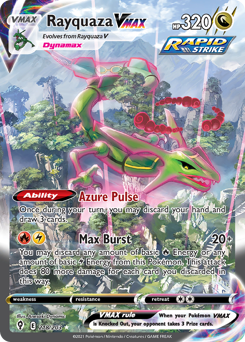 Rayquaza VMAXEvolving Skies · #218 Rayquaza VMAXEvolving Skies · #218 | 15,053 | $2,424 | $36,486,365 | +57% | |
| 12 |  Umbreon VEvolving Skies · #189 Umbreon VEvolving Skies · #189 | 8,485 | $1,086 | $9,215,559 | +85% |
Scarlet & Violet
2023–now14 cardsFit: ln(price) = 6.47 + 0.03 · ln(pop), R² 0.00. Each doubling of population moves the fitted price by +2%.
| # | Card | PSA 10 pop | PSA 10 price | Float | vs curve | |
|---|---|---|---|---|---|---|
| 1 |  Mew exScarlet & Violet — 151 · #205 Mew exScarlet & Violet — 151 · #205 | 5,869 | $251 | $1,473,823 | -69% | |
| 2 | 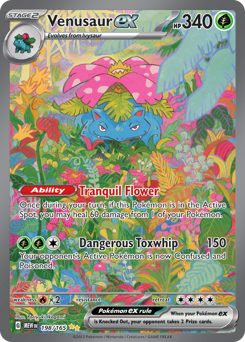 Venusaur exScarlet & Violet — 151 · #198 Venusaur exScarlet & Violet — 151 · #198 | 16,293 | $454 | $7,393,600 | -46% | |
| 3 | 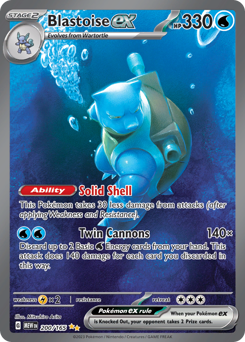 Blastoise exScarlet & Violet — 151 · #200 Blastoise exScarlet & Violet — 151 · #200 | 18,833 | $552 | $10,396,193 | -35% | |
| 4 | 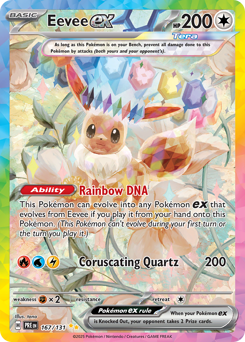 Eevee exPrismatic Evolutions · #167 Eevee exPrismatic Evolutions · #167 | 3,030 | $589 | $1,786,064 | -27% | |
| 5 | 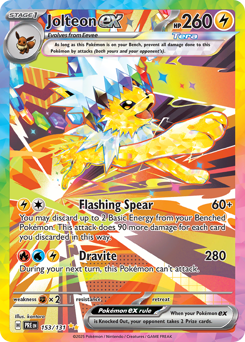 Jolteon exPrismatic Evolutions · #153 Jolteon exPrismatic Evolutions · #153 | 3,169 | $597 | $1,891,513 | -26% | |
| 6 | 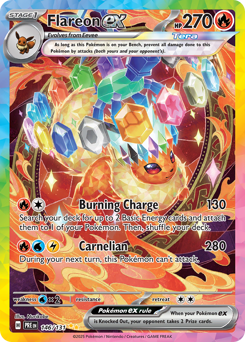 Flareon exPrismatic Evolutions · #146 Flareon exPrismatic Evolutions · #146 | 3,463 | $614 | $2,125,970 | -24% | |
| 7 | 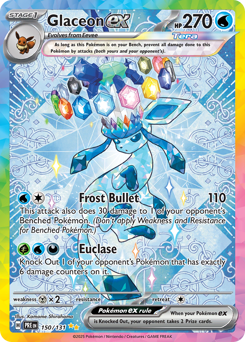 Glaceon exPrismatic Evolutions · #150 Glaceon exPrismatic Evolutions · #150 | 3,661 | $699 | $2,560,247 | -14% | |
| 8 | 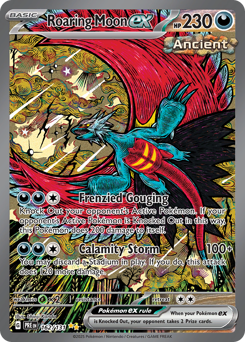 Roaring Moon exPrismatic Evolutions · #162 Roaring Moon exPrismatic Evolutions · #162 | 2,593 | $744 | $1,930,307 | -7% | |
| 9 | 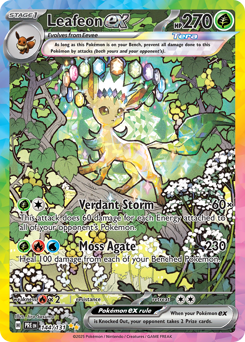 Leafeon exPrismatic Evolutions · #144 Leafeon exPrismatic Evolutions · #144 | 4,296 | $801 | $3,442,943 | -1% | |
| 10 | 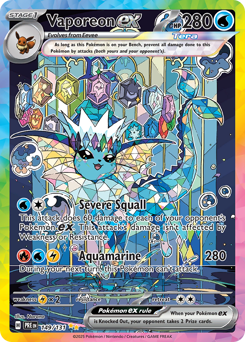 Vaporeon exPrismatic Evolutions · #149 Vaporeon exPrismatic Evolutions · #149 | 2,832 | $995 | $2,818,067 | +24% | |
| 11 | 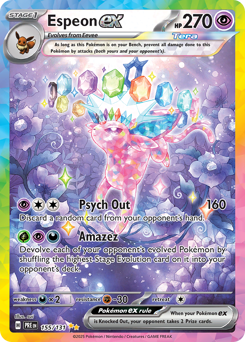 Espeon exPrismatic Evolutions · #155 Espeon exPrismatic Evolutions · #155 | 3,488 | $1,029 | $3,588,280 | +27% | |
| 12 |  Charizard exScarlet & Violet — 151 · #199 Charizard exScarlet & Violet — 151 · #199 | 28,523 | $1,421 | $40,534,891 | +66% | |
| 13 | 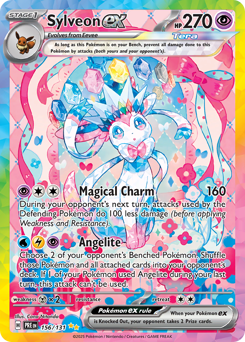 Sylveon exPrismatic Evolutions · #156 Sylveon exPrismatic Evolutions · #156 | 3,974 | $1,419 | $5,638,113 | +75% | thin |
| 14 | 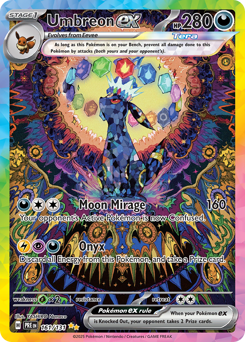 Umbreon exPrismatic Evolutions · #161 Umbreon exPrismatic Evolutions · #161 | 6,399 | $5,154 | $32,980,766 | +527% |
Method
- For every card with a hand-read population (the chase cards plus the ten most valuable cards of each era), take the newest PSA 10 population reading and the blended PSA 10 price. The blend uses the same source weights as the card page, so this screen and the card page never disagree.
- Within each era, fit ln(price) = a + b · ln(pop) by ordinary least squares. Scarcer cards cost more; b is how steeply, for that era. Eras are fitted separately because a 1999 holo and a 2023 special illustration rare do not share a scarcity curve.
- vs curve is the card's distance from its era's line: −30% means it trades 30% below what its population alone would predict among its peers. Cards are ranked most-below first.
- Float is price × population: the total market value of every PSA 10 in existence. A small float is a thin market in both directions.
Only rows with an observed population and an observed PSA 10 price enter the fit; a row resting on the built-in pricer is listed and badged but never moves the line.
One caveat for the vintage era: the PSA 10 price is eBay sales for the TCGplayer product, and on Jungle, Fossil, Team Rocket, Gym and Neo products that one listing covers both the 1st Edition and the unlimited print, so the comp can mix the two while the population is the unlimited line only. Base Set is unaffected, its printings being separate products.
Read the sign of the slope before the residuals. A negative slope is the scarcity story: fewer PSA 10s, higher price. A positive slope, which the modern eras show, means population is tracking demand instead: people grade what sells, so the most-graded cards are the most wanted ones. In that regime a card below the curve is cheap relative to how much it gets graded, not cheap for its scarcity. Both are worth a look; they are different questions.
What this is not: a buy list. A card below the curve can be there for a reason population does not capture: a print with chronic centering problems, a reprint, or simply a card nobody wants at any scarcity. Eras with fewer than 4 cards are shown without a fit, because a line through three points is a line through three points. Population is read by hand from public GemRate-sourced reports and dated; it is not scraped.
99 of 99 tracked cards have both inputs. Generated 2026-09-13 20:46 UTC.