Signals · screen 2
Drawdown vs pop
Cards at least 30% below their high in the observed window, set against whether the supply of PSA 10s grew in the meantime. A fall with flat supply is not a supply story.
one read Population has been read once (1 dated read), so no card can show a population change yet. Until a second read lands, this is a drawdown list over observed prices; the supply column fills in on its own once two reads at least 21 days apart exist.
Observed window 2026-03-18 to 2026-09-13 · 99 of 99 tracked cards have observed history · 6 at or beyond the threshold.
| # | Card | Window high | Now | Drawdown | PSA 10 pop | Supply |
|---|---|---|---|---|---|---|
| 1 | 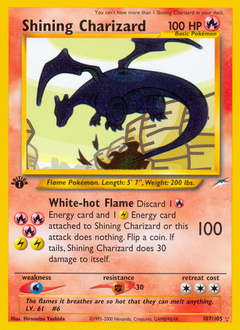 Shining CharizardNeo Destiny · #107 Shining CharizardNeo Destiny · #107 | $3,9992026-03-25 | $1,495 | -63% | 384 | one read |
| 2 |  GengarDiamond & Pearl · #27 GengarDiamond & Pearl · #27 | $2002026-04-22 | $84.52 | -58% | 4 | one read |
| 3 | 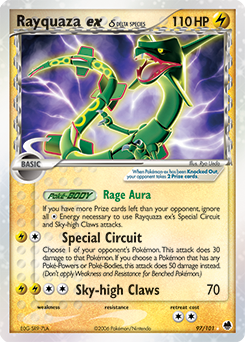 Rayquaza ex δEX Dragon Frontiers · #97 Rayquaza ex δEX Dragon Frontiers · #97 | $4902026-07-31 | $273 | -44% | 64 | one read |
| 4 | 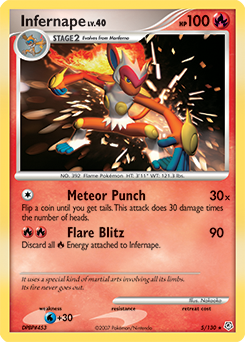 InfernapeDiamond & Pearl · #5 InfernapeDiamond & Pearl · #5 | $49.832026-08-19 | $28.25 | -43% | 4 | one read |
| 5 |  Mew exScarlet & Violet — 151 · #205 Mew exScarlet & Violet — 151 · #205 | $44.532026-05-14 | $29.57 | -34% | 5,869 | one read |
| 6 |  Ninetales δEX Dragon Frontiers · #8 Ninetales δEX Dragon Frontiers · #8 | $2902026-07-26 | $197 | -32% | 46 | one read |
Method
- For every card with population data, take its observed raw near-mint daily history from the price provider. Window high is the highest daily value in the window; now is the latest. Drawdown is now ÷ high − 1. Modelled history is never used; a card with no observed history is not on this screen.
- Population change is the newest PSA 10 count over the oldest count read at least 21 days earlier, minus one. Supply flat means that change is under 5%.
- Cards at or beyond 30% off the high are listed, deepest first.
Honest limits: the price provider's history window is six months on the current plan, so "high" is the window high and the window is printed above. Raw near-mint history is used because that is what exists daily; graded prices are eBay comps and too sparse to take a daily high from. Population reads are hand-loaded and dated, so the supply column can only move as often as they are re-read.
Generated 2026-09-13 20:46 UTC.